
With more than 200 technical indicators, Fortex XForce e-trading platform provides you with a wealth of information and analysis capabilities, giving you the insight you need to make informed trading decisions and stay ahead of market movements. Our platform also offers real-time market data, advanced charting tools, and customizable user interfaces to help you stay on top of your trades. We provide full-fledged technology, allowing trading with real-time market availability, market data streaming, and global assets.
Fortex XForce e-trading platform provides you with 200+ technical analysis indicators. These include: Moving Averages (MAI), Relative Strength Index (RSI), Moving Average Convergence Dispersion (MACD) and Bollinger Bands (BBI)®.
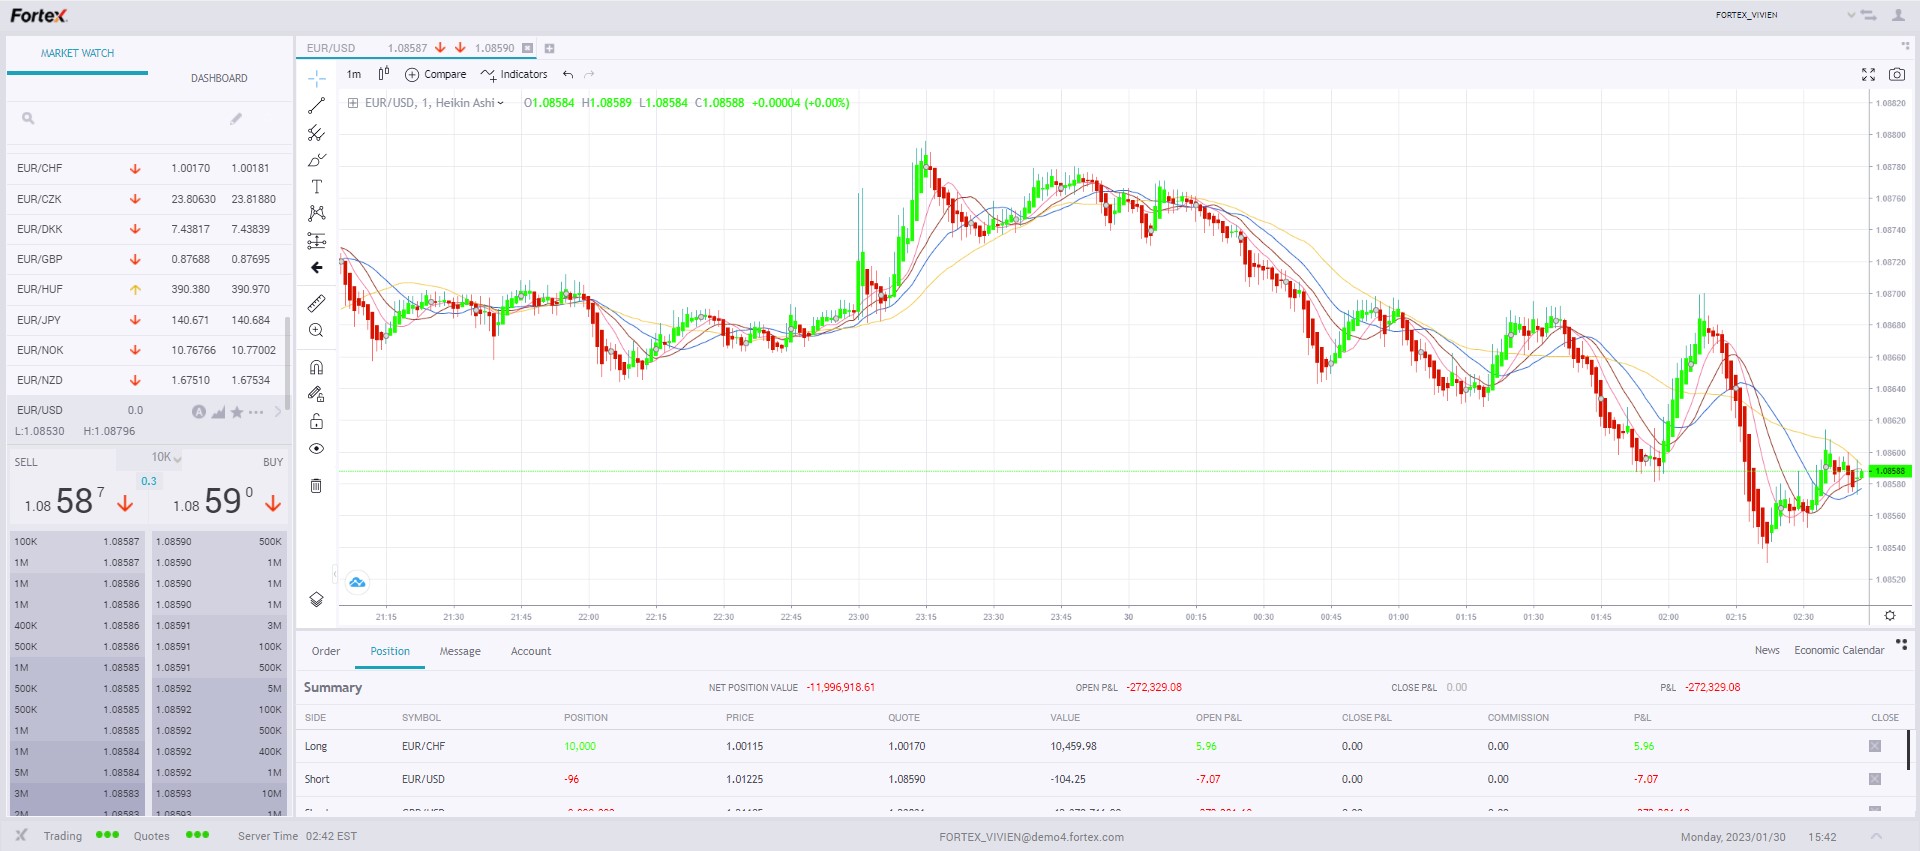
1. Moving Average Indicator (MAI)
MAI is an important trading indicator for identifying trends. It helps analysts or investors determine the potential direction of an asset's price.
The indicator is a continuously calculated value of the price average over a specified time period. It aggregates data points for a financial product over a specific time period and divides the total by the number of data points to arrive at an average. There are two basic forms, including Simple Moving Average (SMA), and Exponential Moving Average (EMA).
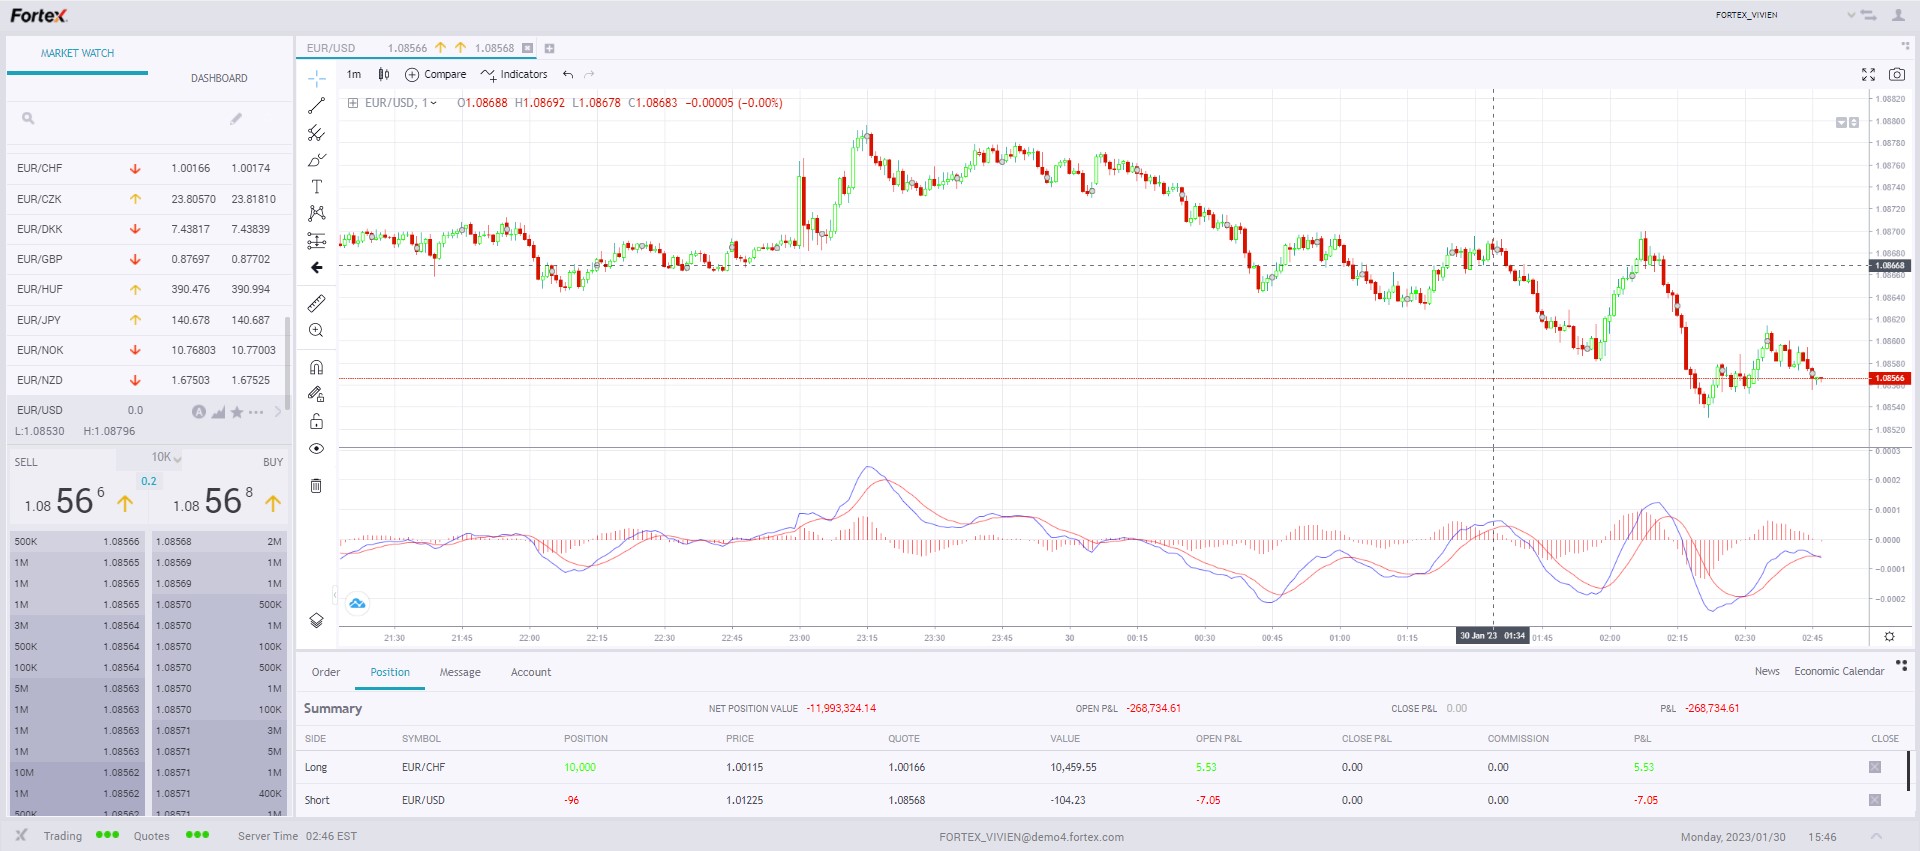
2. Moving Average Convergence Divergence (MACD)
MACD is a technical momentum oscillator. It is mainly used to identify trading trends and is useful for assessing the ability of short-term price movements.
It appears on the chart as two lines that oscillate without boundaries. The crossover of the two lines gives trading signals similar to a two-moving average system. The default settings of MACD used by most traders when entering trades are 12-day EMA, 26-day EMA and 9-day EMA.
The MACD indicator consists of three components: the MACD line, the signal line, and the histogram.
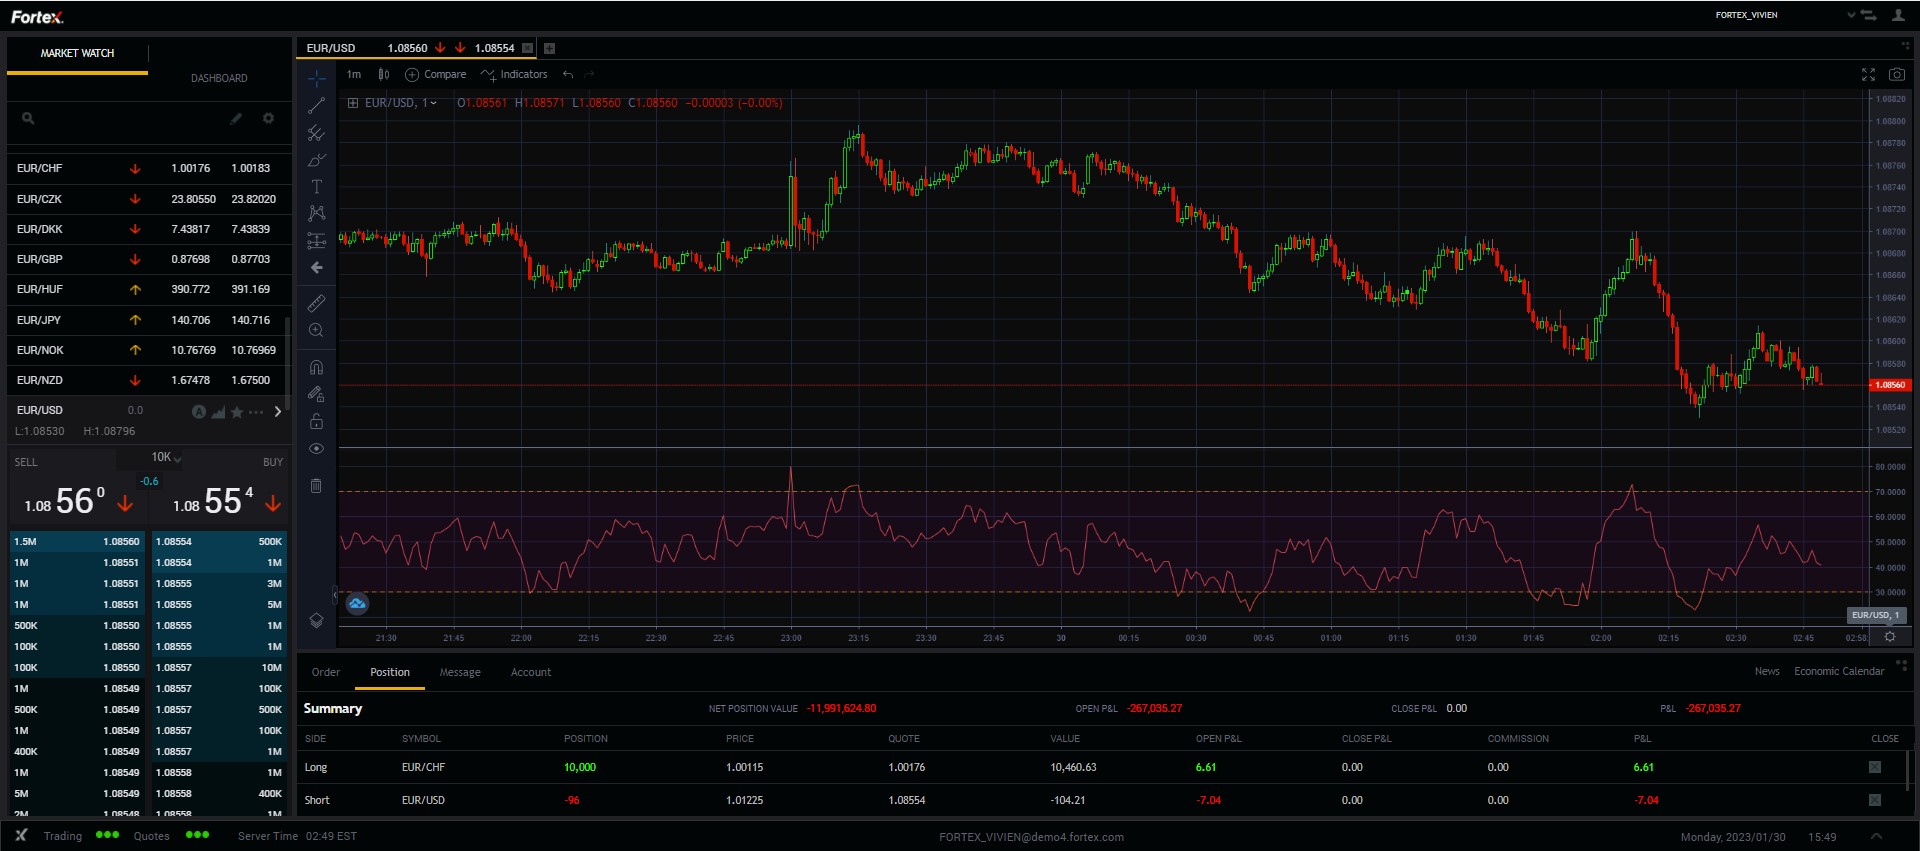
3. Relative Strength Index (RSI)
The RSI is to chart the current and historical strengths or weaknesses of a stock or market based on the closing prices of a recent trading period, comparing recent gains and losses.
It was developed by J. Welles Wilder and is a momentum oscillator that measures the speed and change of price movements. The RSI oscillates between zero and 100. It has now become one of the most popular oscillators.
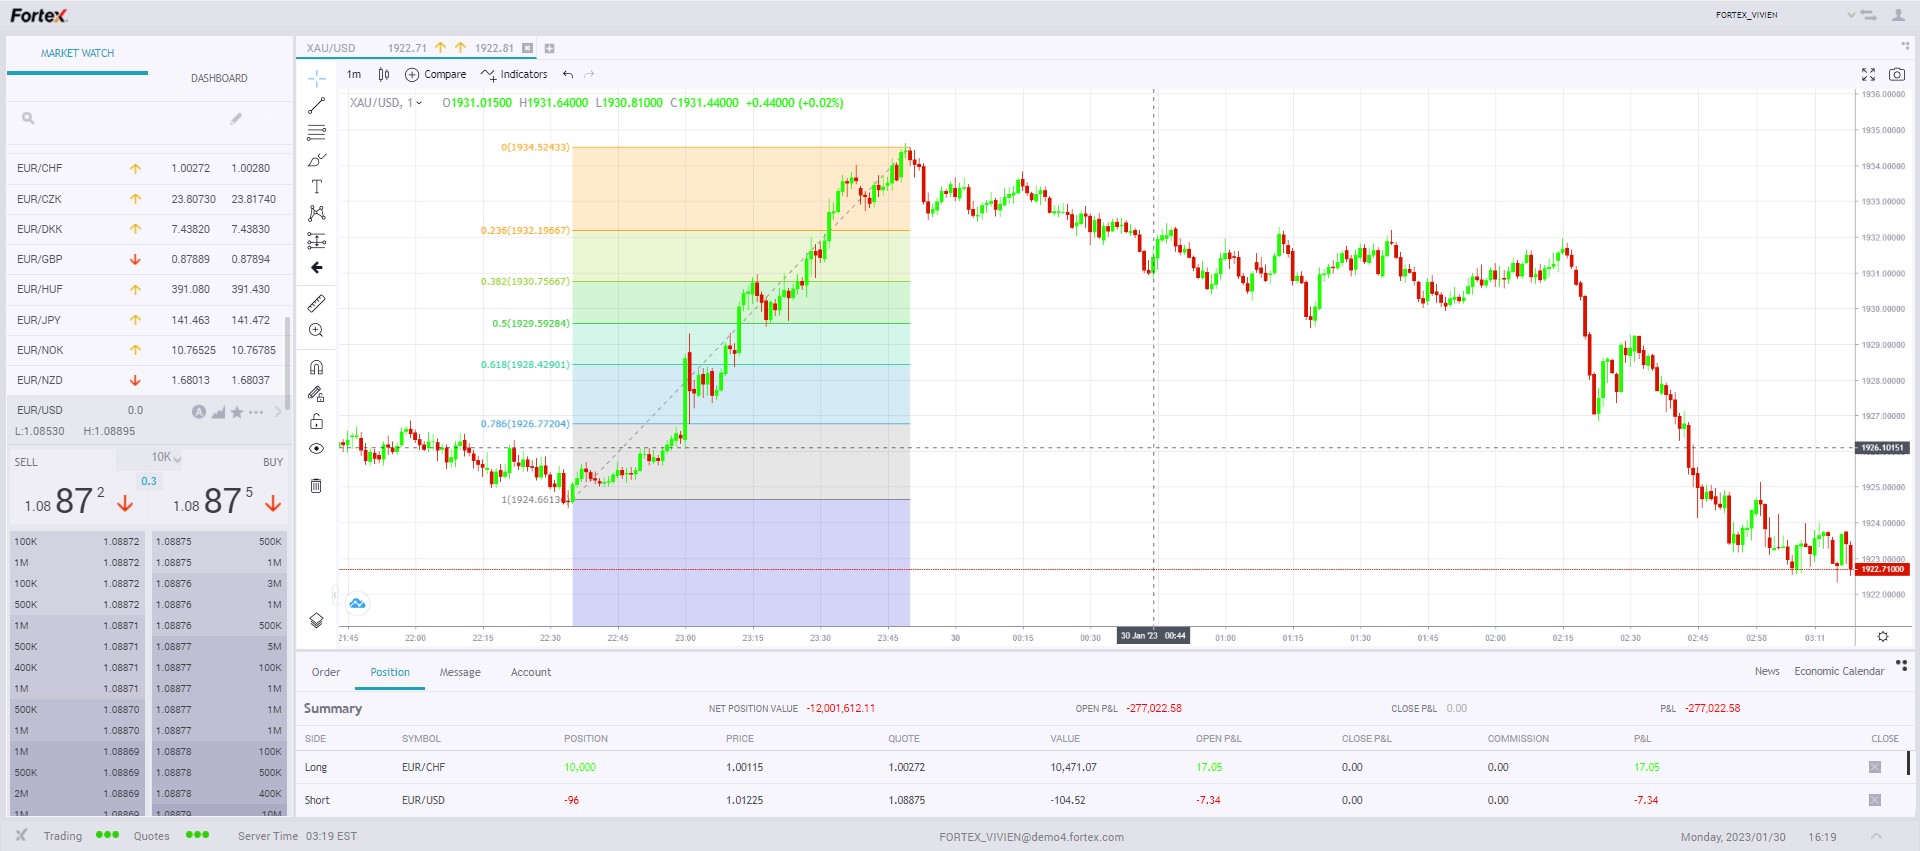
4. Fibonacci Retracement Indicators
The Fibonacci retracement originates from the Fibonacci sequence, which highlights support and resistance levels by drawing horizontal lines on a price chart. This allows investors to avoid buying at the highest or selling at the lowest, and helps to predict where resistance/support may occur. It is displayed by first drawing a trend line between two extreme points. It is widely used to determine the price levels of impulses and retracements in an uptrend or downtrend.
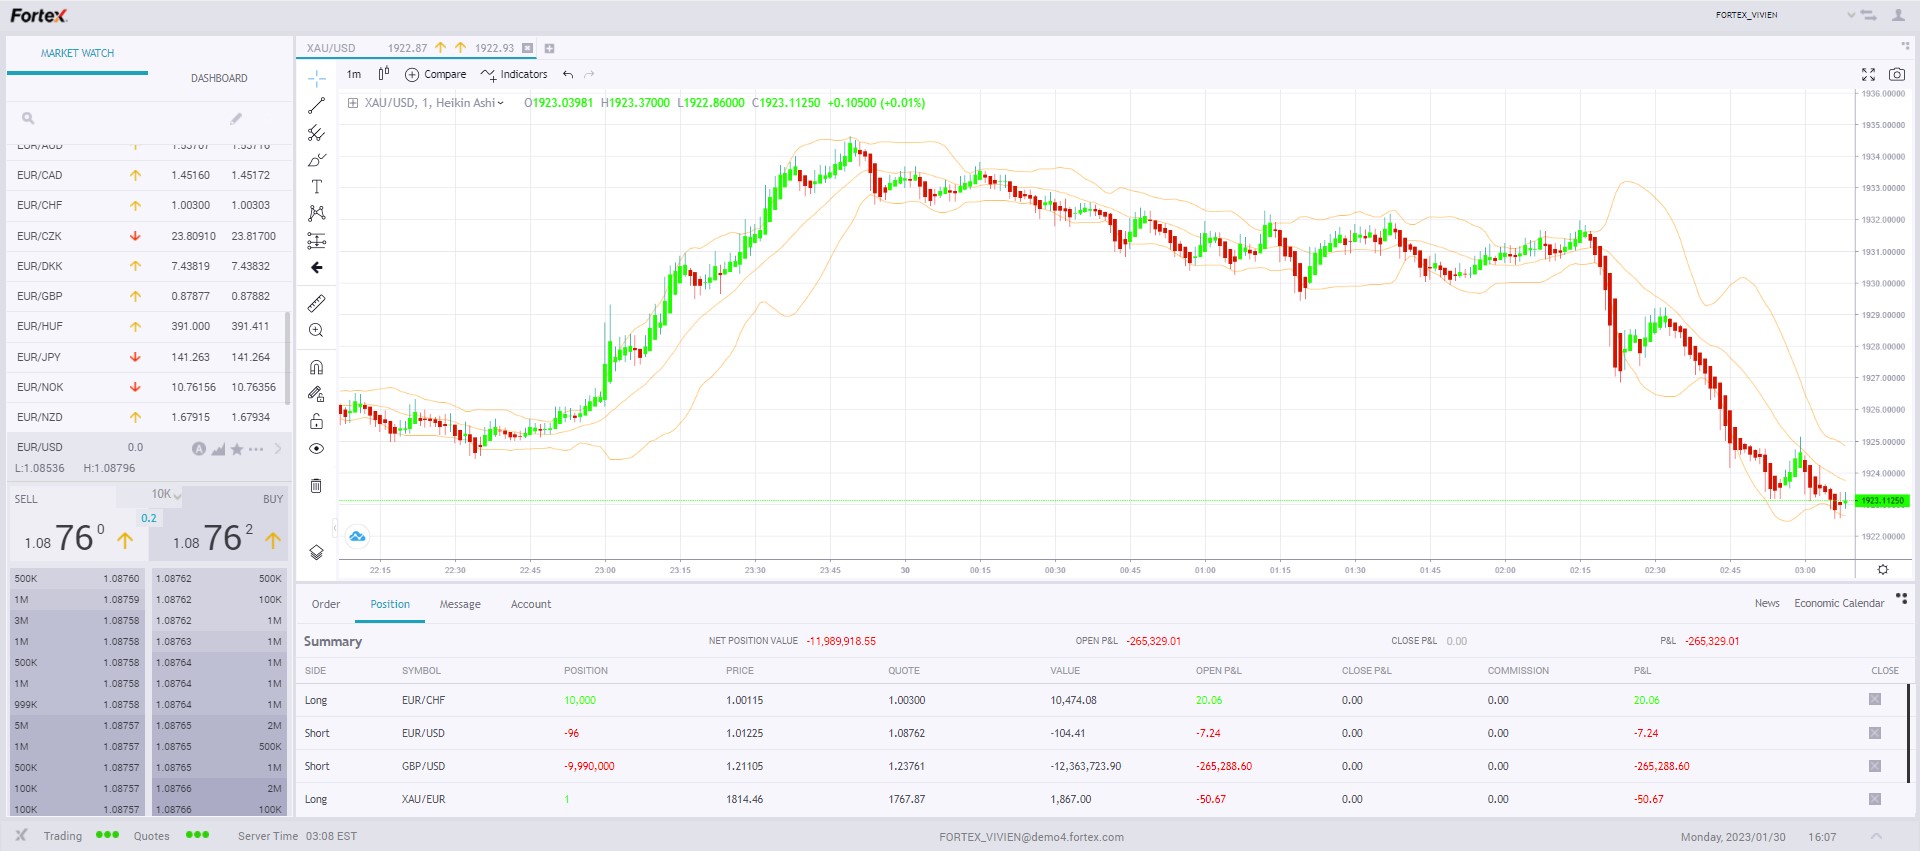
5. Bollinger Bands Indicators
Bollinger Bands, a technical indicator developed by John Bollinger, are used to measure a market’s volatility and identify “overbought” or “oversold” conditions.
Bollinger bands consist of three lines representing volatility, including the middle, upper and lower lines of the simple moving average. It shows the price range of historical trades. The two outer lines show the upper and lower levels of price movement that should be traded 90% of the time, while the middle line shows the real-time price action that moves between these boundaries as each day fluctuates.
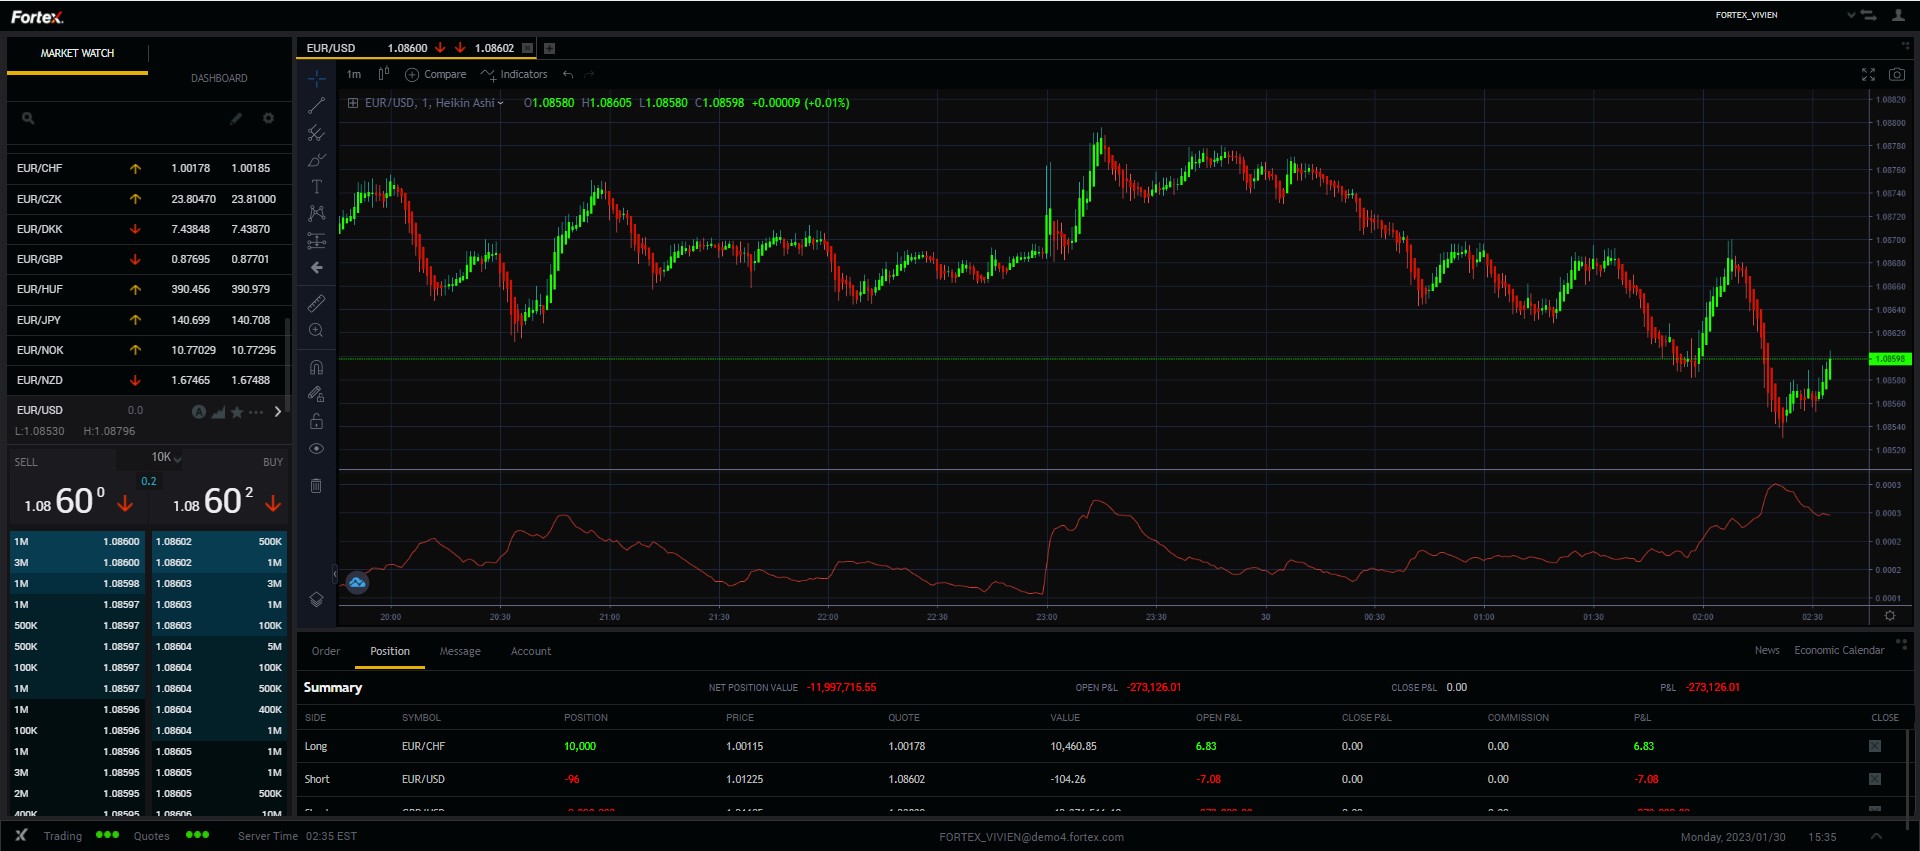
6. Average True Range
The average true range (ATR) is a price volatility indicator showing the average price variation of assets within a given time period. Investors can use the indicator to determine the best time for trading.
ATR values are generally calculated based on 14 periods. The period can be monthly, weekly, daily, or even intraday. It is calculated as the largest of the following 3 values for each period: current high minus current low; current high minus absolute value of previous closing price; current low minus closing price of the previous closing price.
Don't miss out on this opportunity to take your trading to the next level. Get started today and book a demo with us.
Please Leave your message to https://www.fortex.com/en/contact/
About Fortex
Founded in 1997, Fortex Technologies aims to revolutionize trading with its powerful, neutral, multi-asset trading platform focused on the FX, equities. Fortex’s XForce solution, ECN, MT4/5 bridges, infrastructure hosting, and more are used by regional banks, hedge funds, asset managers, broker-dealers, and professional traders around the world to enhance liquidity access, improve execution workflows and support sophisticated trading strategies.